


Financial Highlights
(Unit:Millions of yen)
| FY 2021 |
FY 2022 | ||
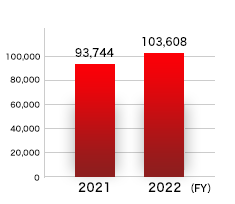
| Revenue |
93,744 (15.2%up) |
103,608 |
|
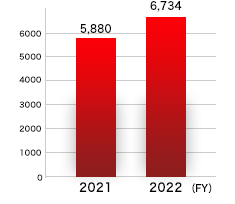
| Core operating income (Notes1) |
5,880 (19.1%up) |
6,734 |
|
| Operating income |
2,665 (50.4%down) |
8,259 |
|
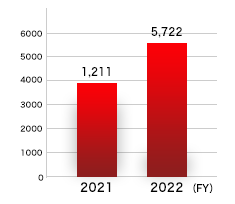
| Profit attributable to owners of parent |
1,211 (69.3%down) |
5,722 |
|
| Total assets |
116,381 (0.1%up) |
118,971 |
|
| Total equity |
72,429 (2.4%up) |
78,013 |
|
| Per |
Basic earnings per share (Yen) | 26.92 | 129.96 |
| Equity attributable to owners of parent per share (Yen) |
1,620.20 | 1,785.25 |
|
| Dividend per share (Yen) | 40 | 52 |
|
| ROE (%) |
1.7% |
7.6% |
|
| Notes 1: | Core operating income was calculated by deducting "cost of sales" and "selling, general and administrative expenses" from "revenue." |
|---|
| Revenue | Core operating income | Profit attributable to owners of parent | ||||||
|---|---|---|---|---|---|---|---|---|
| (Unit:Millions of yen) | ||||||||
 |
 |
 |
||||||