


Financial Highlights
(Unit:Millions of yen)
| FY 2024 |
FY 2025 | ||
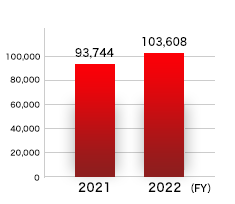
| Revenue |
115,593 (6.8%up) |
119,257 |
|
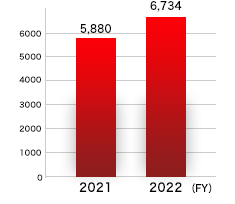
| Core operating profit (Note) |
7,743 (2.1%up) |
9,551 |
|
| Operating profit |
3,480 (-55.2%) |
12,073 |
|
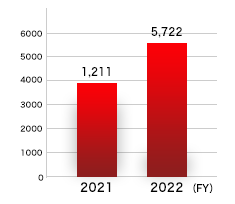
| Profit attributable to owners of parent |
1,496 (-75.8%) |
10,568 |
|
| Total assets |
120,693 (-3.9%) |
131,892 |
|
| Total equity |
82,501 (-3.5%) |
92,872 |
|
| Per |
Basic earnings per share (Yen) | 35.32 | 256.49 |
| Equity attributable to owners of parent per share (Yen) |
1,964.73 | 2,272.46 |
|
| Dividend per share (Yen) | 76 | 120 |
|
| ROE (%) |
1.8% |
12.1% |
|
| Notes: | Core operating profit was calculated by deducting "cost of sales" and "selling, general and administrative expenses" from "revenue." |
|---|
| Revenue | Core operating profit | Profit attributable to owners of parent | ||||||
|---|---|---|---|---|---|---|---|---|
| (Unit:Millions of yen) | ||||||||
 |
 |
 |
||||||